Thursday, April 25, 2013

Libertarian Talk Radio: If You Build It, Ratings Will Come

Seth Mason Charleston SC blog 24
Terrestrial talk radio's key demographic, conservatives, are becoming more libertarian. However, there are few libertarian hosts in terrestrial talk radio. Program directors would be wise to air more of them.

According to Gallup, an increasing number of Americans describe themselves as "conservative", terrestrial talk radio's bread-and-butter political ideology:

Libertarian Talk Radio: If You Build It, Ratings Will Come - US Political Ideology


However, a decreasing number of conservatives identify with "traditional values":

Libertarian Talk Radio: If You Build It, Ratings Will Come - Conservatives' Values


On the other hand, also according to Gallup, an increasing number of Americans consider themselves "libertarian":

Libertarian Talk Radio: If You Build It, Ratings Will Come - Libertarians In The Electorate


And, today, nearly 60% of Americans share some libertarian views:

Libertarian Talk Radio: If You Build It, Ratings Will Come - Number Of Libertarians

However, there are only a handful of libertarian hosts in terrestrial talk radio. This suggests there's a growing under-served demand.

Libertarian Talk Radio: If You Build It, Ratings Will Come - Talk Radio Ratings

Tuesday, April 23, 2013

Fed Liquidity Pumping Good For Wealthy, Bad For Rest

Seth Mason Charleston SC blog 25The premise is simple: the wealthy have a disproportionate amount of their net worth in investments, and the Fed has been propping up the stock market and inflating asset bubbles. Therefore, the price inflation-driven economic recovery has been robust for the richest 7% and weak to non-existent for everyone else. And never forget, wealth and exposure to inflation are inversely-proportional. In other words, those with less money spend a greater percentage of their incomes on essentials--food, energy, etc.--whose prices have been rising as a result of the asset bubble. From Pew Research:
During the first two years of the nation’s economic recovery, the mean net worth of households in the upper 7% of the wealth distribution rose by an estimated 28%, while the mean net worth of households in the lower 93% dropped by 4%, according to a Pew Research Center analysis of newly released Census Bureau data.

Fed Liquidity Pumping Good For Wealthy, Bad For Rest- Change In Net WorthFrom 2009 to 2011, the mean wealth of the 8 million households in the more affluent group rose to an estimated $3,173,895 from an estimated $2,476,244, while the mean wealth of the 111 million households in the less affluent group fell to an estimated $133,817 from an estimated $139,896.

These wide variances were driven by the fact that the stock and bond market rallied during the 2009 to 2011 period while the housing market remained flat.

Affluent households typically have their assets concentrated in stocks and other financial holdings, while less affluent households typically have their wealth more heavily concentrated in the value of their home.

From the end of the recession in 2009 through 2011 (the last year for which Census Bureau wealth data are available), the 8 million households in the U.S. with a net worth above $836,033 saw their aggregate wealth rise by an estimated $5.6 trillion, while the 111 million households with a net worth at or below that level saw their aggregate wealth decline by an estimated $0.6 trillion.1
Fed Liquidity Pumping Good For Wealthy, Bad For Rest - Household Net Worth
Because of these differences, wealth inequality increased during the first two years of the recovery. The upper 7% of households saw their aggregate share of the nation’s overall household wealth pie rise to 63% in 2011, up from 56% in 2009. On an individual household basis, the mean wealth of households in this more affluent group was almost 24 times that of those in the less affluent group in 2011. At the start of the recovery in 2009, that ratio had been less than 18-to-1.
(The focus in this report on the upper 7% of households rather than some other share of high wealth households reflects the limits of the tabulations published by the Census Bureau. The boundaries of its wealth categories dictated the split of households analyzed in this report.)

Overall, the wealth of America’s households rose by $5 trillion, or 14%, during this period, from $35.2 trillion in 2009 to $40.2 trillion in 2011.2 Household wealth is the sum of all assets, such as a home, car, real property, a 401(k), stocks and other financial holdings, minus the sum of all debts, such as a mortgage, car loan, credit card debt and student loans.

During the period under study, the S&P 500 rose by 34% (and has since risen by an additional 26%), while the S&P/Case-Shiller home price index fell by 5%, continuing a steep slide that began with the crash of the housing market in 2006. (Housing prices have slowly started to rebound in the past year but remain 29% below their 2006 peak.)
The different performance of financial asset and housing markets from 2009 to 2011 explains virtually all of the variances in the trajectories of wealth holdings among affluent and less affluent households during this period. Among households with net worth of $500,000 or more, 65% of their wealth comes from financial holdings, such as stocks, bonds and 401(k) accounts, and 17% comes from their home. Among households with net worth of less than $500,000, just 33% of their wealth comes from financial assets and 50% comes from their home.

Fed Liquidity Pumping Good For Wealthy, Bad For Rest - Change In Assets

The Census Bureau data also indicate that among less affluent households, fewer directly owned stocks and mutual fund shares in 2011 (13%) than in 2009 (16%), meaning a smaller share enjoyed the fruits of the stock market rally. Likewise, fewer had individual retirement accounts (IRAs) or Keogh accounts (22% in 2011 versus 24% in 2009) and the same share had 401(k) or Thrift Savings Plan accounts (39% in both years). Among affluent households, there was also a decline in the share directly owning stock and mutual fund shares during this period (59% in 2011 versus 62% in 2009), but a slight increase in the share with IRAs or Keogh accounts (70% versus 68%) and a larger increase in the share with 401(k) or Thrift Savings Plan accounts (65% versus 61%).

Overall, net worth per household in the U.S. in 2011 made up nearly all the ground it had lost since 2005—$338,950 versus $340,252 in 2005, the latest pre-recession data published by the Census Bureau. (Total household wealth doubtless rose for a period after 2005 before falling precipitously during the Great Recession of 2007-2009 and rebounding since then. However, no household wealth data are available from the Census Bureau for the years between 2005 and 2009, so it is not possible to pinpoint when, or at what level, the peak in wealth per household occurred.)

Looking at the period from 2005 to 2009, Census Bureau data show that mean net worth declined by 12% for households as a whole but remained unchanged for households with a net worth of $500,000 and over. Households in that top wealth category had a mean of $1,590,075 in wealth in 2005, $1,585,441 in 2009 and $1,920,956 in 2011.3

Seth Mason, Charleston SC

Sunday, April 21, 2013

Economy Creating Lost Generation

Seth Mason Charleston SC blog 26
I don't seek out bad economic data; bad economic data find me. I gather data from numerous reputable sources, and, sometimes, reputable sources send them to me. One of these reputable sources is John Lounsbury, Founding Partner and Managing Editor at Econintersect LLC. This morning, John sent me the following article about the lost generation that the current economic depression has been creating:
The inordinate growth of student loans – and its effect on the economy – is killing consumption (autos) and the housing sector.  This is no short term dynamic, but will effect the economy for decades.
Economy Creating Lost Generation - Consumer Credit Outstanding
The USA is a consumer driven economy.  A study released this week authored by Meta Brown and Sydnee Caldwell stated:
As a result of tighter underwriting standards, higher delinquency rates, and lower credit scores, consumers with educational debt may have more limited access to housing and auto debt and, as a result, more limited options in the housing and vehicle markets, despite their comparatively high earning potential.
Economy Creating Lost Generation - Credit Risk Scores
Both these factors—lowered expectations of future earnings and more limited access to credit—may have broad implications for the ongoing recovery of the housing and vehicle markets, and of U.S. consumer spending more generally. While highly skilled young workers have traditionally provided a vital influx of new, affluent consumers to U.S. housing and auto markets, unprecedented student debt may dampen their influence in today’s marketplace.
Some believe the lack of jobs is causing a higher than normal attendance in schools – but historical data from the BLS shows attendance appears moderating.
Economy Creating Lost Generation - College/University Attendance
And there seems little correlation between the ability of the young to get jobs and enrollment in colleges / universities.
Economy Creating Lost Generation - Labor Force Participation
The student loan growth phenomenon seems to be directly related to cost inflation of education outstripping the general rate of inflation by significant multiples.  The following table is from a study by Jordan Bowersox and Jonathan Breazeale.

Yearly Cost of Colleges / Universities

Economy Creating Lost Generation - Cost Of College
This study appears to correlate well with the associated BLS education cost index.
Economy Creating Lost Generation - Tuition Inflation
It is interesting to this author that economists talk about the economic drag by the baby boomers on the economy, but yet ignore the built in drag of higher education on the economy.  The young are historically higher consumers than the old – yet the cost of education is weakening the ability of the young to consume.
It's important to note that ever-expensive higher education not leading to good-paying jobs not only prevents younger people from contributing to the economy as consumers; it impedes their ability to achieve life milestones that contribute to the economy: getting married, having children, etc.

Seth Mason, Charleston SC

Saturday, April 20, 2013

Thursday, April 4, 2013

It's GOP Vs. America On Social Issues, War

Seth Mason Charleston SC blog 28America's economic future is uncertain. But one thing this country has going for it is its burgeoning liberty movement. A great many Americans have become weary of the nanny state and the prospect of endless war. Today, a majority of Americans support the legalization of marijuana, marriage equality, believe the war in Iraq was a mistake, and believe we shouldn't still be in Afghanistan. Most Republicans, on the other hand, are on the wrong side of each of these issues:

On the legalization of marijuana:

America:

It's GOP Vs. America On Social Issues, War - Legalization Of Marijuana Poll - America

GOP:

It's GOP Vs. America On Social Issues, War - Legalization Of Marijuana Poll - GOP

On marriage equality:

America:

It's GOP Vs. America On Social Issues, War - Gay Marriage Poll - America

GOP:

It's GOP Vs. America On Social Issues, War - Gay Marriage Poll - GOP

On war:

America on Iraq:

It's GOP Vs. America On Social Issues, War - Iraq War Poll - America

GOP on Iraq:

It's GOP Vs. America On Social Issues, War - Iraq War Poll - GOP

America vs. GOP on Afghanistan:

It's GOP Vs. America On Social Issues, War - Afghanistan War Poll - America vs. GOP

Wake up and smell the liberty, GOP. Lest you become a dinosaur party.

Seth Mason, Charleston SC

Monday, April 1, 2013

America's Economic Depression In 5 Charts

Seth Mason Charleston SC blog 29This is not what economic recovery looks like. This is, however, what an economic depression looks like:

First, the American workforce is far smaller than it was before the 2008 economic collapse, even though the number of Americans of working age has increased by several million:

America's Economic Depression In 5 Charts - Labor Force Participation Rate

 Second, the people who are lucky enough to be gainfully employed are earning less, adjusted for inflation:

America's Economic Depression In 5 Charts - Real Household Income

Third, with far fewer people employed, those who are employed earning less, and the long-term unemployed and underemployed depleting their savings, the number of Americans living in poverty continues to grow:

America's Economic Depression In 5 Charts - US Households In Poverty

Fourth, with the employed earning less, millions of unemployed and underemployed depleting their savings, and interest rates at record lows, Americans are saving less:

America's Economic Depression In 5 Charts - US Personal Savings Rate

Finally, the number of Americans dependent on the government for basic survival has grown by tens of millions:

America's Economic Depression In 5 Charts - Number Of Americans On Food Stamps

Only 2 words adequately describe the past 5 years: economic depression. 

Seth Mason, Charleston SC

Sunday, March 31, 2013

Keynesian-Monetarist Economist: Fed Responsible For High Unemployment

Seth Mason Charleston SC blog 30Keynesian-Monetarist Stanford economist John B. Tayor, an advocate of heavy Fed intervention in the economy, has come to believe that the Fed's ultra-loose monetary policy was responsible for the 2008 economic implosion and the subsequent protracted period of high unemployment. Furthermore, he believes that the Fed's "solution" to the economic depression and high unemployment we've experienced over the past 5 years, massive money printing and record-low interest rates, will ultimately result in additional harm to the economy and even more unemployment:
What's your assessment of the Federal Reserve's recent actions to help spur the economy? 

The Fed has engaged in extraordinarily loose monetary policy, including two rounds of so-called quantitative easing.

These large-scale purchases of mortgages and Treasury debt were aimed at lifting the value of those securities, thereby bringing down interest rates. I believe quantitative easing has been ineffective at best and potentially harmful.

Harmful how?
 
The Fed has effectively replaced large segments of the market with itself -- it bought 77% of new federal debt in 2011, my calculations show. By doing so, the Fed has created great uncertainty about the impact of its actions on inflation, the dollar, and the economy.
The existence of quantitative easing as a policy tool creates uncertainty, as traders speculate on whether and when the Fed is going to intervene. It's bad for the U.S. stock market, which should reflect the earnings of corporations.

You believe the Fed's mission needs to be changed.
 
The Fed needs to focus on a single goal of long-run price stability. We should remove the Fed's dual mandate of maximum employment and stable prices, which was put into effect in the 1970s.

From 2003 to 2005, the Fed held interest rates too low for too long. A primary reason was its concern that raising rates would increase unemployment.

The unintended consequence was that low rates fueled the housing bubble, which in turn led to the recession and high unemployment.

More recently, the Fed has cited concerns over employment to justify its interventions, including quantitative easing. Removing the dual mandate would take away that excuse.
That came from a Keynesian!

Seth Mason, Charleston SC

Thursday, March 28, 2013

Marriage Licenses Are Unconstitutional. Here's Why.

Seth Mason Charleston SC blog 31
With everyone opining about marriage equality, few people are asking the more important question: What business does government have in the *religious* institution of marriage? Think about it: Every state in the union requires a license to marry. And what is a license? According to Webster, it's "a permission granted by competent authority to engage in a business or occupation or in an activity otherwise unlawful". So, one cannot enter into the religious institution of marriage without permission from the state. Here's why that's unconstitutional:

The Free Exercise Clause of the Constitution guarantees the free exercise of religious covenants. Marriage is a religious covenant and can exist independently of government. In fact, marriage predates government by several thousands of years. Religious ceremonies uniting amorous couples existed as early as 20,000 B.C, eons before the institution of government. The concept of uniting amorous couples is uniquely religious in nature, and the legislation of marriage has only come about because of the spillover of religion into the political system.

The ubiquitous requirement of a state-issued license to marry is an unconstitutional impediment to the free exercise of the uniquely religious practice of uniting amorous people. Requiring a license, the state can deny one the ability to marry even if one's religion permits it. The Unitarian Church, for example, offers ceremonies for same-sex couples. However, the ceremonies are considered a formality only in states that only issue licenses to opposite-sex couples. In other words, government impedes the free exercise of the institution of marriage in the Unitarian Church because it prohibits full nuptial ceremonies from being conducted in most states.

Justice Ginsburg called weddings as a formality "skim milk marriages". The "dairy", the religious institution, can't offer "whole milk" without permission from the government. That requirement is clearly unconstitutional.

Seth Mason, Charleston SC

Wednesday, March 13, 2013

The Falling Unemployment Rate Lie Visualized

Seth Mason Charleston SC blog 32
If you get your business/economics news from sources outside of the MSM, you're likely aware that the BLS has been crushing down the labor force participation rate in order to lower the unemployment rate. But even the well-informed may not have seen a chart of the data massaging.

Washington has been selling the narrative that a population the size of New York City--approximately 10 million people--have thought that an economic depression would be a good time in which to either retire, stop looking for work, or reach working age but not even look for a job. As you can see, since the Great Depression, the unemployment rate has never fallen in tandem with the labor force participation rate like it has since the Great Recession:

The Falling Unemployment Rate Lie Visualized - unemployment vs. labor force participation

Tuesday, March 12, 2013

Big Pharma: The Crony Capitalist Industry

Seth Mason Charleston SC blog 33
Crony capitalism, often manifested as using the power of government to hinder competition, is the antithesis of free-market capitalism. Crony capitalism hurts the consumer, lowers economic output, and stifles innovation and entrepreneurism.

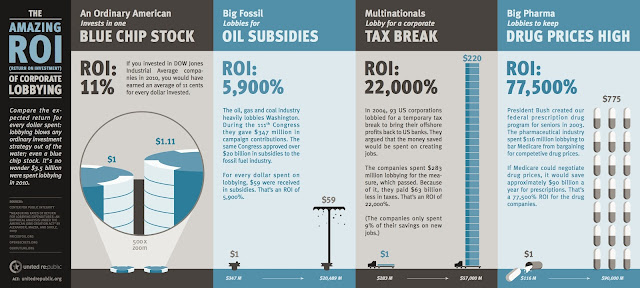
Lobbying is the primary means by which crony capitalists convince the government to protect their interests. And no industry lobbies the government like Big Pharma, as the next two charts clearly show.

The healthcare industry spent $5.3 billion on lobbying from 1998-2012, approximately half on pharmaceutical lobbying:

Big Pharma: The Crony Capitalist Industry - lobbying dollars spent by industry

Big Pharma's lobbying dollars yield a great return: $77,500 for every dollar spent!

Big Pharma: The Crony Capitalist Industry - pharma lobbying ROI

Dylan Ratigan wrote an excellent piece on the ways in which Big Pharma wields its power in Washington. According to Ratigan, pharmaceutical lobbying costs the average American $1,600 per year in the form of artificially-high drug costs. This discounts, of course, the massive human costs in the form of suffering that could be eliminated with the advent of new drugs that don't see the light of day:
When he first ran for president, Barack Obama campaigned against the influence of lobbyists in Washington, exclaiming in one ad in which he excoriated the top lobbyist of the drug industry, "I don't want to learn how to play the game better. I want to put an end to the game playing."

Then, Obama won the White House and sought to pass an ambitious health care agenda. To do so, he made nice with some of Capitol Hill's most notorious influence peddlers.
There are few industries with as much power in Washington as the pharmaceutical sector. Drug companies have spent $2.3 billion on lobbying and $183 million on campaign contributions since 1998, according to the Center for Responsive Politics. The industry also maintains a war chest for advertising and grassroots lobbying aimed at altering public opinion. The ready money serves as a strong deterrent against any legislative proposal that would lower costs for consumers and profits for the drug makers.

"The industry clearly had established a war chest ... to use on advertising on health care reform," said Richard Kirsch, the national campaign manager for Health Care for America Now and the author of the forthcoming book "Fighting for Our Health." "It was very clear that ... if the administration and Congress pushed for negotiating drug prices for Medicare in health care reform, that the industry would vociferously oppose that."

Fearing the drug industry would use its money and lobbyists to torpedo the entire reform package, the Obama White House made a deal to kill at least two major provisions that would have saved consumers money when they filled prescriptions. In exchange, the industry unleashed a $20 million-plus ad campaign to support the bill. Senate Finance Committee Chairman Max Baucus (D-Mont.), a top recipient of campaign contributions from the health care industry, was put in charge of shepherding the bill to passage.
But pharma's influence didn't start with the Affordable Care Act. The industry has been blocking pro-consumer drug policies for years.

In 2003, Congress passed a prescription drug benefit for seniors known as Medicare Part D. However, thanks to industry involvement in writing the bill, the agency in charge of Medicare was barred from negotiating with drug companies to lower prices, as the Department of Veterans Affairs does. The author of that legislation was none other than Rep. Billy Tauzin (R-La.), who barely a year later would retire from Congress and land on K Street as president of Pharmaceutical Research and Manufacturers of America -- in other words, the drug industry's top lobbyist.

When the Obama White House later sought support from the drug industry for health care reform, the administration had to shelve the idea of releasing Medicare from the negotiation ban. Studies indicate that keeping drug prices high for seniors adds $150 billion to $300 billion to drug industry profits over a 10-year period. The increased costs hit the pockets of both seniors and taxpayers.

In Wisconsin, some seniors get a better deal. SeniorCare, a popular state program covering 91,000 Wisconsinites that was created by then-Gov. Tommy Thompson (R), sets much lower drug prices than Medicare's prescription drug benefit. It only costs $522 on average to cover a senior through SeniorCare; it costs $1,690 on average under Medicare Part D. In 2009, SeniorCare saved seniors some $50 million.

When Gov. Scott Walker (R) came into office last year, he proposed gutting SeniorCare. Wisconsin lawmakers from both parties joined together to remove this provision from the
governor's first budget.

Nino Amato, president of the Coalition of Wisconsin Aging Groups, told The Huffington Post that relying on Medicare Part D alone to hold down drug prices forces seniors to "make life decision trade-offs."

"Life decision trade-offs" can mean choosing between drugs or electricity or food. For millions of Americans, this is a real and growing problem.

According to a 2010 Kaiser Family Foundation study, drug prescriptions rose by 39 percent while drug prices nearly doubled over the last decade. More and more individuals, hard pressed to pay for medications, are opting to abandon their prescriptions. In 2009, the number of patients who did not fill or pick up prescriptions increased by 23 percent from the previous year and 68 percent from 2006.

Some Americans have tried to close the budget gap by quietly buying drugs from Canada, where government controls keep prices down. U.S. law, however, prohibits the reimportation of prescription drugs from other countries.

Efforts were made to lift the ban as part of the health care overhaul -- but the drug industry didn't like that, and the Senate Democratic leadership fell in line. Despite having previously won the support of enough senators to become law, an amendment to permit prescription drug reimportation, offered by then-Sen. Byron Dorgan (D-N.D.), was defeated amid mass vote switching.

After his amendment went down, Dorgan told reporters, "I believe seven days ago we had sufficient votes to pass it, but I think what is happening in the intervening period is other things developed. It's a great disappointment because it seems to me very hard to do health care reform without doing something about the escalating prices for prescription drugs."
Sens. Debbie Stabenow (D-Mich.) and Olympia Snowe (R-Maine) are now trying again, co-sponsoring a bill that would legalize reimportation of drugs from certain countries. They argue that the bill would save taxpayers $19.4 billion and let millions of Americans pay drug prices that are 35 to 55 percent less.

Beyond the health care deal, the pharmaceutical sector continues to fight other pro-consumer measures. During the last Congress, a provision attached to an appropriations bill would have banned "pay-for-delay," when brand-name drug makers pay off generic drug makers to keep generics off the market. The Federal Trade Commission estimates that pay-for-delay costs consumers billions of dollars annually.

The provision, which barely made it out of committee, was killed during the lame-duck 2010 Congress. Four Republican senators voiced their opposition to Senate Minority Leader Mitch McConnell (R-Ky.). The appropriations bill containing the provision was shelved, and Congress passed a continuing resolution to fund the government instead.

Again, those supporting a more pro-consumer policy have not given up. Sen. Charles Grassley (R-Iowa) is currently co-sponsor of a bill in Congress that would give the FTC authority to stop pay-for-delay litigation settlements. In a November 2011 press release, Grassley argued, "When people across the country are having a hard time making ends meet, this could be a real boost to their bottom line."

Perhaps ordinary Americans will win the next fight over pharmaceutical policy. In the meantime, drug prices rise while the drug industry thrives, backed by its powerhouse lobbying presence in Washington.
 Seth Mason, Charleston SC

Monday, February 18, 2013

America Remains In A Jobs Depression

Seth Mason Charleston SC blog 34
In a recent op-ed in the Wall Street Journal, business mogul Mort Zuckerman recently penned an editorial that argues that the United States remains in the depths of a protracted "jobs depression" that's far worse than the mainstream media reports:
Jobs! President Obama has set a record. In his speech to Congress on Tuesday, he uttered the word "jobs" more than in any of his previous four State of the Union addresses. His 45 mentions were more than double the references to any of the other policy ambitions encapsulated in his speech by such words as health, education, immigration, guns, deficit, debt, energy, climate, economy, Afghanistan, wage, spend or tax (the runner-up).
If only the president's record on unemployment were as good.

After four years America remains in a jobs depression as great as the Great Depression. 
Notice that Zuckerman said "as great as the Great Depression". Comparisons of this economic depression to the Great Depression are apt.
But the crisis isn't seen in that light because the country isn't confronted daily by scenes of despair like the 1930s photographs of bread lines and soup kitchens and thousands of men (very few women then) waiting all day outside a factory in a forlorn quest for work.
But the jobless are still in the millions across the land, little changed in their total since the 1930s: 12.3 million today officially fully unemployed compared with 12.8 million in 1933 at the depth of the Depression.

Yes, the U.S. population is much larger now, but 12 million out of work still means 12 million lives devastated. And that number masks the true vastness of the modern disaster.
The jobless today are much less visible than they were in the 1930s because relief is organized differently. Today in the "recovery," the millions are being assisted, out of sight, by government checks, unemployment checks, Social Security disability checks and food stamps.
He's correct: Entitlements are the new soup lines. Not seeing the desperate masses doesn't mean that they don't exist.
More than 48 million Americans are in the food-stamp program—an almost incredible record. That is 15% of the total population compared with the 7.9% participation in food stamps from 1970-2000. Then there are the more than 11 million Americans who are collecting Social Security checks to compensate for disability, also a record. Half have signed on since President Obama came to office. In 1992, there was one person on disability for every 35 workers; today it is one for every 16.

Such an increase is simply impossible to connect to direct disability experienced during employment, for it is inconceivable that work in America has become so dangerous. For many, this disability program has become another form of unemployment compensation, only this time without end.

But the predicament of our times is worse than that, worse in its way than the 1930s figures might suggest. Employers are either shortening the workweek or asking employees to take unpaid leave in unprecedented numbers. Neither those on disability nor those on leave are included in the unemployment numbers.
I've repeated this line a number of times: the government and the MSM discount the fact that there's a quality component to jobs as well as a quantity component. Not only is the aggregate number of unemployed people worse than reported, but the majority of jobs created during this depression have been of the part-time, menial variety.
The U.S. labor market, which peaked in November 2007 when there were 139,143,000 jobs, now encompasses only 132,705,000 workers, a drop of 6.4 million jobs from the peak. The only work that has increased is part-time, and that is because it allows employers to reduce costs through a diminished benefit package or none at all.

The broadest measure of unemployment today is approximately 14.5%, way above the 7.9% headline number. The 14.5% reflects the unemployed and three other categories: the more than eight million people who are employed part-time for economic reasons (because their hours have been cut back or because they are unable to find a full-time job), the 10 million who have stopped looking for work, and those who are "marginally attached" to the workforce.
In its latest report, Gallup, a very reliable source, reported that the underemployment rate is north of 19%:

America Remains In A Jobs Depression - unemployment chart
The labor-force participation rate has dropped to the lowest level since 1981.
It reflects discouraged workers who have dropped out of the labor force. If it were not for the dropouts, the formally announced unemployment rate would be around 9.8%, not the headline 7.9%.

Sometimes the employment numbers that are announced are simply not understood. January was supposed to have seen 157,000 jobs created. The news provoked relief and even enthusiasm in some quarters. But the supposed hiring was based on seasonally adjusted numbers—numbers adjusted to reflect regularly occurring shifts in employment, such as increased hiring of farm workers during crop harvests or retail employees after Thanksgiving. The real, unadjusted figures for January show that nearly 2.8 million jobs disappeared, which happened to be worse than the 2.63 million lost in January 2012. Even though the 157,000 jobs created were fewer than the 311,000 of January 2012, many commentators cheered because they don't understand the effects of seasonal adjustment.
So there is no solace in the statistics. Job seekers are only one-third as likely to find work as they were five years ago, and a record number of households have at least one member looking for a job, which affects everyone. And most of the newly available jobs don't match the pay, the hours or the benefits of the millions of positions that have vanished.
It typically takes 25 months to close the employment gap from the employment peak near the start of the downturn. Yet this time, more than 60 months after employment peaked in January 2006, nonfarm unemployment is still more than three million jobs below where it started.
Sobering stuff.

Eileen Appelbaum, senior economist at the Center for Economic and Policy Research, argues that recovery cannot become self-perpetuated until the unemployed get good jobs and resume contributing to consumer spending at their maximum potential. Unfortunately, many of the long-term unemployed aren't finding jobs; they're falling off of the radar screen.

I can't stress this enough: Those who are unfortunate enough to find themselves among the ranks of the perennially jobless typically face a lifetime of depressed earnings. (One study suggests that long-term unemployment can cut one's lifetime earning potential by as much as 20%.) The longer that the job market remains bleak (remember, it's been 5 years and counting), the more people fall into the category of long-term unemployed, whether or not the government counts them as such. In the short term, that means a drag on the economy. In the long-term, that means the creation of a new underclass.

Seth Mason, Charleston SC

Tuesday, January 8, 2013

Infographic: America's PhDs On Food Stamps

Seth Mason Charleston SC blog 35
College, with its skyrocketing tuition costs and high degree inflation, has become a questionable investment in this high-unemployment/low-wage economy. Even doctorate programs have lost their luster. From OnlineColleges.net:

Infographic: America's PhDs On Food Stamps - infographic

Monday, January 7, 2013

The Definitive Inflation Chart

Seth Mason Charleston SC blog 36There are several takeaways from this chart: 1) Inflation was essentially non-existent until the creation of the Federal Reserve in 1913. 2) War, which requires massive government spending, promotes inflation. 3) Inflation has skyrocketed since Nixon took us off the gold standard in 1971, which gave the Fed a carte blanche to print. 4) Bernanke's concern about deflation is unfounded. See that tiny break in the inflation trendline above the "Great Recession arrow"? That's the deflation he's concerned about.
The Definitive Inflation Chart - historical CPI chart


Just for giggles, let's compare that last chart with a chart of the national debt:

The Definitive Inflation Chart - national debt chart


Is it clear enough that the Fed enables deficit spending?

Seth Mason, Charleston SC