Showing posts with label underemployment. Show all posts

Thursday, October 16, 2014

New Non-Profit Takes On The Federal Reserve

Seth Mason Charleston SC blog 1Update  01/10/15: Because I've ceased publishing ECOMINOES, I've removed a great many articles I believe have become less relevant over time. I've deleted as many links that were broken as I could find...I apologize if I missed any. Also, due to the proliferation of spam, I've closed comments and deleted the ECOMINOES Facebook page and Twitter account.

It's been a pleasure promoting economic and individual liberty here on ECOMINOES. Now, I'm taking my passion to the next level by launching Solidus.Center, a 501(c)(3) non-profit that promotes economic strength and stability, sound money, equality of opportunity, and reduced government debt by limiting the Federal Reserve System’s influence on the American economy.

The following is a brief video explaining this new venture:


Solidus.Center is currently in the start-up phase, and we're looking for help. If you or anyone you know might be interested in board, fellowship, or volunteer opportunities, please contact me at seth@solidus.center.

Thank you so much for following ECOMINOES! I hope you'll join me on the next level.

Seth Mason, Charleston SC

Wednesday, January 15, 2014

Jobs Depression Year 6: More Americans Worse Off Financially

Seth Mason Charleston SC blog 11Gallup reports that, in the last year, more Americans have become worse off financially than better off. This revelation--five and a half years after the fall of Lehman--is just the latest evidence that our jobs depression continues. (Article continues after chart.)

Depression Year 6: More Americans Worse Off Financially - change in financial situation

For years, I've been calling this period of American history a jobs depression. Before calling me a Chicken Little for using the "D" word, please keep in mind that, while there's no official definition for "depression" in an economic sense, most economists call protracted periods of economic malaise "depressions".

And the last 6 years have absolutely been a protracted period of economic malaise.

Years after the economy bottomed in 2009, the epidemic of long-term unemployment and underemployment continues to afflict the American workforce. Incredibly, 5 years into "recovery", fewer jobs were created last year than the year before. And, as has been the case throughout this depression, the vast majority of jobs created last year were menial in nature. Very few new "breadwinner" jobs.

Keep in mind that the unacceptably tepid jobs recovery that we have had has been merely a result of the inflation of the Fed's latest asset bubble. The Fed's balance sheet just passed $4 trillion...that's 22% of the entire economy! The Fed has been feigning healthy economic growth for years by inflating what Nouriel Roubini is calling the "mother of all bubbles".

Seth Mason, Charleston SC

Friday, January 10, 2014

More Bureau Of Labor Statistics Data Manipulation?

Seth Mason Charleston SC blog 12Last month, I predicted that the Bureau of Labor Statistics would remove from the workforce many of the 1.3 million Americans who lost their unemployment benefits this month. And that's exactly what happened. According to the BLS, 5 people left the workforce for every job added last month. And yet, the unemployment rate mysteriously fell from 7% to 6.7%.

The BLS, which is under investigation for data manipulation, has been proven wrong before. According to ZeroHedge, here's what the "headline" unemployment rate would look like if the bureau used the 30-year average labor force participation rate as opposed to its current 1970s rate. Keep in mind that this chart DOESN'T COUNT the tens of millions of UNDERemployed Americans. Lest we forget, a woefully insufficient number of "breadwinner" jobs have been created since the economy crashed.

More Bureau Of Labor Statistics Data Manipulation - real unemployment rate

Using the 30 year average labor force participation rate, we get a headline unemployment rate hovering between 11 and 12 percent. And, again, that doesn't count the tens of millions of Americans working below their capabilities. Gallup pegs the UNDERemployment rate at 17.2%. Recalculating the underemployment rate using the 30-year average participation rate, we get a number closer to 20%.

The BLS, of course, has been crushing down the headline unemployment rate by crushing down the labor force participation rate, as evidenced by the following chart:

More Bureau Of Labor Statistics Data Manipulation - unemployment vs. labor force participation

Considering this next chart, it's highly unlikely that unemployment has dropped from 10% to 6% over the last few years, as the BLS has been reporting.

More Bureau Of Labor Statistics Data Manipulation - mean duration of unemployment

Thursday, June 20, 2013

No Recovery For "Breadwinner" Jobs

Seth Mason Charleston SC blog 17Former Reagan budget director David Stockman has been quite outspoken about the Federal Reserve's role in collapsing the economy. Much of his new book, The Great Deformation, explains how the Fed led us into this economic depression and how our central bank is now inflating an asset bubble that will eclipse the mid-2000s housing bubble. This new, larger bubble, Stockman says, will eventually burst and crash the economy once more.
 
In The Great Deformation, Stockman frequently notes that the post-Great Recession "recovery" has been nothing but rampant Fed-fueled asset speculation. In Chapter 31, the former budget director explains that, while the speculation has been a windfall for the wealthiest among us, it's done next to nothing to improve the atrocious job market:
After the US economy liquidated excess inventory and labor and hit its natural bottom in June 2009, it embarked upon a halting but wholly unnatural “recovery.” The artificial prolongation of the Bush tax cuts, the 2 percent payroll tax abatement and the spend-out of the Obama stimulus pilfered several trillions from future taxpayers in order to gift America’s present day “consumption units” with the wherewithal to buy more shoes and soda pop.

But there has been no recovery of the Main Street economy where it counts; that is, no revival of breadwinner jobs and earned incomes on the free market.
What we have once again is faux prosperity. In fact, the current Bernanke Bubble is an even sketchier version of the last one and consists essentially of the deliberate and relentless reflation of financial asset prices.

In practice, this amounts to a monetary version of “trickle down” economics. By September 2012, personal consumption expenditure (PCE) was up by $1.2 trillion from the prior peak, representing a modest 2.2 percent per year (0.6 percent after inflation) gain from the level of late 2007. Yet half of this gain—more than $600 billion—reflected the massive growth of government transfer payments, and much of the rebound which did occur in private consumption spending was concentrated in the top 10–20 percent of households. In short, the Fed’s financial repression policies enabled Uncle Sam to fund transfer payments for the bottom rungs of society at virtually no carry cost on the debt, while they juiced the top rungs with a wealth effects tonic that boosted spending at Nordstrom’s and Coach.

The Fed’s post-Lehman money printing spree has thus failed to revive Main Street, but it has ignited yet another round of rampant speculation in the risk asset classes. Accordingly, the net worth of the 1 percent is temporarily back to the pre-crisis status quo ante.
Conservatives often scoff at the phrase "1 percent". But it's absolutely true that Fed liquidity pumping has been great for the wealthiest Americans but bad for the rest of us. The reason is simple: 1) inflation--a natural byproduct of liquidity pumping--is good for most investment classes but bad for nearly every other sector of the economy, and 2) the wealthiest among us have the majority of their net worth in investments that benefit most from inflation: equities, commodities, and real estate.
Needless to say, successful speculation in the fast money complex is not a sign of honest economic recovery: it merely marks the prelude to another spectacular meltdown in the canyons of Wall Street next time the music stops.
In the following subsection, Stockman details the sunset of American "breadwinner" jobs:
The precarious foundation of the Bernanke Bubble is starkly evident in the internal composition of the jobs numbers. At the time the US economy peaked in December 2007, there were 71.8 million “breadwinner” jobs in construction, manufacturing, white-collar professions, government, and full-time private services. These jobs accounted for more than half of the nation’s 138 million total payroll and on average paid about $50,000 per year—just enough to support a family.

Breadwinner jobs also generated more than 65 percent of earned wage and salary income and are thus the foundation of the Main Street economy. Yet after a brutal 5.6 million loss of breadwinner jobs during the Great Recession, a startling fact stands out: less than 4 percent of that loss had been recovered after 40 months of so-called recovery.
The 3 million jobs recovered since the recession ended in June 2009, in fact, have been entirely concentrated in the two far more marginal categories that comprise the balance of the national payroll. More than half of the recovery (1.6 million jobs) occurred in what is essentially the “part-time economy.” It presently includes 36.4 million jobs in retail, hotels, restaurants, shoe-shine stands, and temporary help agencies where average annualized compensation was only $19,000. This vast swath of the jobs economy—27 percent of the total—is thus comprised of entry level, second earner, and episodic jobs that enable their holders to barely scrape by.
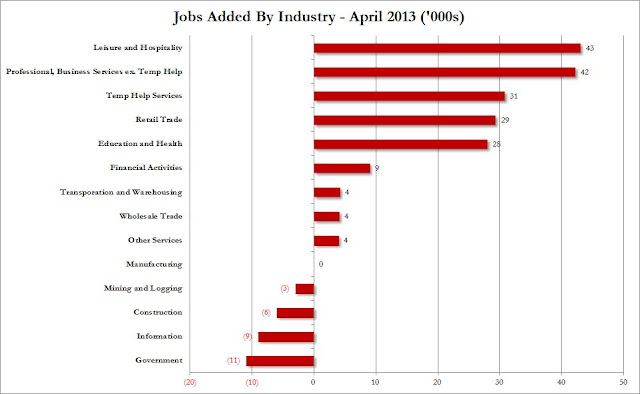
The April jobs report exemplifies the dearth of good jobs. While April is historically the strongest month for hiring, this April saw a woefully insufficient number of jobs created, more than half of the new jobs in either the hospitality industry (think: bartenders, waitresses, etc.) or temp jobs. Again, that was in the strongest month for hiring 5 years after Lehman.
The balance of the pick-up (1.1 million jobs) was in the HES Complex, which consists of 30.7 million jobs in health, education, and social services. Average compensation is slightly better at about $35,000 annually and this category has grown steadily for years. Its increasingly salient disability, however, is that it is almost entirely dependent on government spending and tax subsidies, and thus faces the headwind of the nation’s growing fiscal insolvency.

When viewed in this three category framework, the nation’s job picture reveals a lopsided aspect that thoroughly belies the headline claims of recovery. A healthy Main Street economy self-evidently depends upon growth in breadwinner jobs, but there has been none, even during the bubble years before the financial crisis. The Bureau of Labor Statistics (BLS) reported 71.8 million breadwinner jobs in January 2000, yet seven years later in December 2007—after the huge boom in housing, real estate, household consumption, and the stock market—the number was still exactly 71.8 million.
Stockman is saying what I've been saying all along: the economy hasn't been "right" since the Fed's tech bubble burst in the early 2000s. He's saying that all we've seen in the new millennium has been cycles of artificial booms and busts built on shaky fundamentals that have never allowed a full recovery of the job market. Stockman elaborates on the shaky fundamentals in the concluding paragraphs of the subsection:
The faux prosperity of the Fed’s bubble finance is thus starkly evident. This is the single most important metric of Main Street economic health, and not only had there been zero new breadwinner jobs on a peak-to-peak basis, but that alarming fact had been completely ignored by the smugly confident monetary politburo.

Alas, the latter was blithely tracking a feedback loop of its own making. Flooding Wall Street with easy money, it saw the stock averages soar and pronounced itself pleased with the resulting “wealth effects.” Turning the nation’s homes into debt-dispensing ATMs, it witnessed a household consumption spree and marveled that the “incoming” macroeconomic data was better than expected. That these deformations were mistaken for prosperity and sustainable economic growth gives witness to the everlasting folly of the monetary doctrines now in vogue in the Eccles Building.

To be sure, nominal GDP did grow by 40 percent, or about $4 trillion, between 2000 and 2007. Yet there should be no mystery as to how it happened. As has been noted, total debt outstanding grew by $20 trillion during that same period. The American economy was thus being pushed forward by a bow wave of debt, not pulled higher by rising productivity and earned income.

Indeed, the modest gain of 7.5 million jobs during those seven years reflected exactly this debt-driven dynamic and explains why none of these job gains were in the breadwinner categories. Instead, about 2.5 million were accounted for by the part-time economy jobs described above. On an income-equivalent basis these were actually “40 percent jobs” because they represented an average of twenty-five hours per week and paid $14 per hour, compared to a standard forty-hour work week and a national average wage rate of $22 per hour. Thus, spending their trillions of MEW windfalls at malls, bars, restaurants, vacation spots, and athletic clubs, homeowners and the prosperous classes, in effect, temporarily hired the renters and the increasing legions of marginal workers left behind.

Likewise, another 5 million jobs were generated in the HES (health, education, and social services) complex. Here the job count grew by 20 percent, but it was mainly due to the fact that the sector’s paymasters - government budgets and tax-preferred employer health plans - were temporarily flush.

However, these, too, were “debt-push” jobs that paid modest wages. While the steady 2.6 percent annual growth of HES jobs during the second Greenspan Bubble did flatter the monthly employment “print,” it was possible only so long as government and health plans could keep spending at rates far higher than the growth rate of the national economy.
Fed-fueled rampant asset speculation inflated the housing bubble, which burst and crashed the economy, making the prospect of securing a "breadwinner" job but a dream for many intelligent, educated, perfectly employable Americans. Now, the Fed is enabling what notable economist Nouriel Roubini is calling the "mother of all bubbles".

Seth Mason, Charleston SC

Friday, May 3, 2013

April Employment Increase: Nothing But Menial Jobs

Seth Mason Charleston SC blog 21Readers of this blog know that Washington's employment data should be scrutinized. The Bureau of Labor Statistics is notorious for crushing down the labor force participation rate in order to make it appear that the unemployment rate is falling, and the agency's survey methodology is fundamentally-flawed, according to a former BLS leader. But, even if you take the government's word on unemployment as the "Gospel truth", a 50,000-150,000 monthly net increase in jobs--as Uncle Sam has been reporting for years--is woefully insufficient. At this rate of increase--with the unemployment rate dropping by a tenth of a percent each month--, it would take until 2017 to get back to the lower end of the "full employment" range. And that's IF the economy has no additional difficulties and WITH the help of a crushed-down labor participation rate. And, that's if you consider 5% unemployment and 10% underemployment "full employment".

But the raw jobs numbers don't tell the full story anyway. What does it matter if 50,000 or 150,000 or even 1,000,000 jobs are created each month if the jobs are menial in nature? And make no mistake: we've been seeing for years little but a monthly increase in low-wage, low-skill jobs. The April jobs report showed more of the same.

The overwhelming majority of jobs created last month were in leisure and hospitality (waiters, bartenders, hotel employees, etc.) and temp jobs. Industries that actually produce something, whether it be information or physical goods, actually lost jobs:

April Employment Increase: Nothing But Menial Jobs - Jobs By Industry


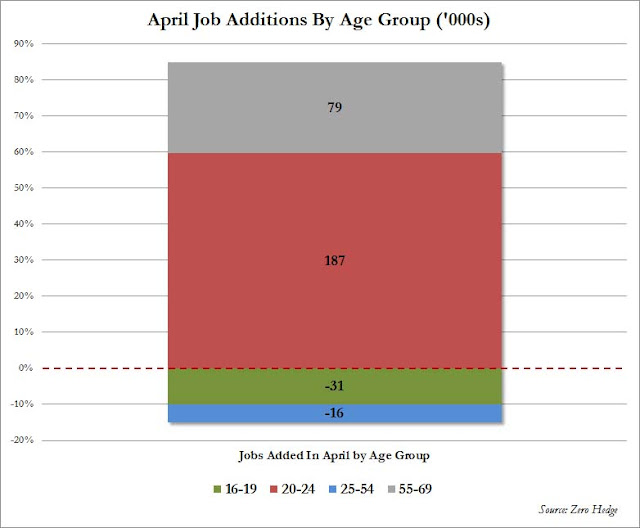
There was a net decrease in jobs for Americans of prime working age, i.e. there was a net decrease in "career" jobs. But there was a net increase in jobs for Americans of prime restaurant worker and Walmart greeter ages:

April Employment Increase: Nothing But Menial Jobs - Jobs By Age Group


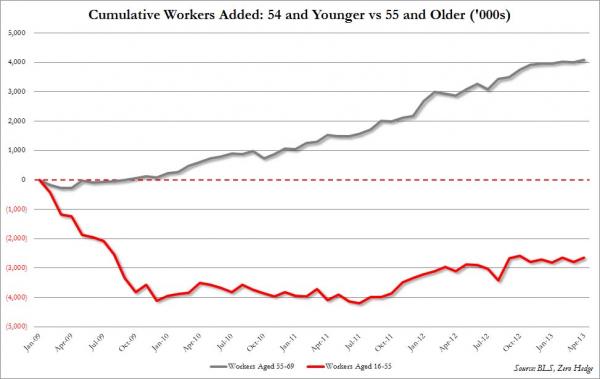
In fact, the number of jobs for Americans of prime working age (i.e. career age) has been flat since the economy collapsed:

April Employment Increase: Nothing But Menial Jobs - Retirees Remaining In The Workforce

Seth Mason, Charleston SC

Sunday, April 21, 2013

Economy Creating Lost Generation

Seth Mason Charleston SC blog 26
I don't seek out bad economic data; bad economic data find me. I gather data from numerous reputable sources, and, sometimes, reputable sources send them to me. One of these reputable sources is John Lounsbury, Founding Partner and Managing Editor at Econintersect LLC. This morning, John sent me the following article about the lost generation that the current economic depression has been creating:
The inordinate growth of student loans – and its effect on the economy – is killing consumption (autos) and the housing sector.  This is no short term dynamic, but will effect the economy for decades.
Economy Creating Lost Generation - Consumer Credit Outstanding
The USA is a consumer driven economy.  A study released this week authored by Meta Brown and Sydnee Caldwell stated:
As a result of tighter underwriting standards, higher delinquency rates, and lower credit scores, consumers with educational debt may have more limited access to housing and auto debt and, as a result, more limited options in the housing and vehicle markets, despite their comparatively high earning potential.
Economy Creating Lost Generation - Credit Risk Scores
Both these factors—lowered expectations of future earnings and more limited access to credit—may have broad implications for the ongoing recovery of the housing and vehicle markets, and of U.S. consumer spending more generally. While highly skilled young workers have traditionally provided a vital influx of new, affluent consumers to U.S. housing and auto markets, unprecedented student debt may dampen their influence in today’s marketplace.
Some believe the lack of jobs is causing a higher than normal attendance in schools – but historical data from the BLS shows attendance appears moderating.
Economy Creating Lost Generation - College/University Attendance
And there seems little correlation between the ability of the young to get jobs and enrollment in colleges / universities.
Economy Creating Lost Generation - Labor Force Participation
The student loan growth phenomenon seems to be directly related to cost inflation of education outstripping the general rate of inflation by significant multiples.  The following table is from a study by Jordan Bowersox and Jonathan Breazeale.

Yearly Cost of Colleges / Universities

Economy Creating Lost Generation - Cost Of College
This study appears to correlate well with the associated BLS education cost index.
Economy Creating Lost Generation - Tuition Inflation
It is interesting to this author that economists talk about the economic drag by the baby boomers on the economy, but yet ignore the built in drag of higher education on the economy.  The young are historically higher consumers than the old – yet the cost of education is weakening the ability of the young to consume.
It's important to note that ever-expensive higher education not leading to good-paying jobs not only prevents younger people from contributing to the economy as consumers; it impedes their ability to achieve life milestones that contribute to the economy: getting married, having children, etc.

Seth Mason, Charleston SC

Wednesday, March 13, 2013

The Falling Unemployment Rate Lie Visualized

Seth Mason Charleston SC blog 32
If you get your business/economics news from sources outside of the MSM, you're likely aware that the BLS has been crushing down the labor force participation rate in order to lower the unemployment rate. But even the well-informed may not have seen a chart of the data massaging.

Washington has been selling the narrative that a population the size of New York City--approximately 10 million people--have thought that an economic depression would be a good time in which to either retire, stop looking for work, or reach working age but not even look for a job. As you can see, since the Great Depression, the unemployment rate has never fallen in tandem with the labor force participation rate like it has since the Great Recession:

The Falling Unemployment Rate Lie Visualized - unemployment vs. labor force participation

Monday, February 18, 2013

America Remains In A Jobs Depression

Seth Mason Charleston SC blog 34
In a recent op-ed in the Wall Street Journal, business mogul Mort Zuckerman recently penned an editorial that argues that the United States remains in the depths of a protracted "jobs depression" that's far worse than the mainstream media reports:
Jobs! President Obama has set a record. In his speech to Congress on Tuesday, he uttered the word "jobs" more than in any of his previous four State of the Union addresses. His 45 mentions were more than double the references to any of the other policy ambitions encapsulated in his speech by such words as health, education, immigration, guns, deficit, debt, energy, climate, economy, Afghanistan, wage, spend or tax (the runner-up).
If only the president's record on unemployment were as good.

After four years America remains in a jobs depression as great as the Great Depression. 
Notice that Zuckerman said "as great as the Great Depression". Comparisons of this economic depression to the Great Depression are apt.
But the crisis isn't seen in that light because the country isn't confronted daily by scenes of despair like the 1930s photographs of bread lines and soup kitchens and thousands of men (very few women then) waiting all day outside a factory in a forlorn quest for work.
But the jobless are still in the millions across the land, little changed in their total since the 1930s: 12.3 million today officially fully unemployed compared with 12.8 million in 1933 at the depth of the Depression.

Yes, the U.S. population is much larger now, but 12 million out of work still means 12 million lives devastated. And that number masks the true vastness of the modern disaster.
The jobless today are much less visible than they were in the 1930s because relief is organized differently. Today in the "recovery," the millions are being assisted, out of sight, by government checks, unemployment checks, Social Security disability checks and food stamps.
He's correct: Entitlements are the new soup lines. Not seeing the desperate masses doesn't mean that they don't exist.
More than 48 million Americans are in the food-stamp program—an almost incredible record. That is 15% of the total population compared with the 7.9% participation in food stamps from 1970-2000. Then there are the more than 11 million Americans who are collecting Social Security checks to compensate for disability, also a record. Half have signed on since President Obama came to office. In 1992, there was one person on disability for every 35 workers; today it is one for every 16.

Such an increase is simply impossible to connect to direct disability experienced during employment, for it is inconceivable that work in America has become so dangerous. For many, this disability program has become another form of unemployment compensation, only this time without end.

But the predicament of our times is worse than that, worse in its way than the 1930s figures might suggest. Employers are either shortening the workweek or asking employees to take unpaid leave in unprecedented numbers. Neither those on disability nor those on leave are included in the unemployment numbers.
I've repeated this line a number of times: the government and the MSM discount the fact that there's a quality component to jobs as well as a quantity component. Not only is the aggregate number of unemployed people worse than reported, but the majority of jobs created during this depression have been of the part-time, menial variety.
The U.S. labor market, which peaked in November 2007 when there were 139,143,000 jobs, now encompasses only 132,705,000 workers, a drop of 6.4 million jobs from the peak. The only work that has increased is part-time, and that is because it allows employers to reduce costs through a diminished benefit package or none at all.

The broadest measure of unemployment today is approximately 14.5%, way above the 7.9% headline number. The 14.5% reflects the unemployed and three other categories: the more than eight million people who are employed part-time for economic reasons (because their hours have been cut back or because they are unable to find a full-time job), the 10 million who have stopped looking for work, and those who are "marginally attached" to the workforce.
In its latest report, Gallup, a very reliable source, reported that the underemployment rate is north of 19%:

America Remains In A Jobs Depression - unemployment chart
The labor-force participation rate has dropped to the lowest level since 1981.
It reflects discouraged workers who have dropped out of the labor force. If it were not for the dropouts, the formally announced unemployment rate would be around 9.8%, not the headline 7.9%.

Sometimes the employment numbers that are announced are simply not understood. January was supposed to have seen 157,000 jobs created. The news provoked relief and even enthusiasm in some quarters. But the supposed hiring was based on seasonally adjusted numbers—numbers adjusted to reflect regularly occurring shifts in employment, such as increased hiring of farm workers during crop harvests or retail employees after Thanksgiving. The real, unadjusted figures for January show that nearly 2.8 million jobs disappeared, which happened to be worse than the 2.63 million lost in January 2012. Even though the 157,000 jobs created were fewer than the 311,000 of January 2012, many commentators cheered because they don't understand the effects of seasonal adjustment.
So there is no solace in the statistics. Job seekers are only one-third as likely to find work as they were five years ago, and a record number of households have at least one member looking for a job, which affects everyone. And most of the newly available jobs don't match the pay, the hours or the benefits of the millions of positions that have vanished.
It typically takes 25 months to close the employment gap from the employment peak near the start of the downturn. Yet this time, more than 60 months after employment peaked in January 2006, nonfarm unemployment is still more than three million jobs below where it started.
Sobering stuff.

Eileen Appelbaum, senior economist at the Center for Economic and Policy Research, argues that recovery cannot become self-perpetuated until the unemployed get good jobs and resume contributing to consumer spending at their maximum potential. Unfortunately, many of the long-term unemployed aren't finding jobs; they're falling off of the radar screen.

I can't stress this enough: Those who are unfortunate enough to find themselves among the ranks of the perennially jobless typically face a lifetime of depressed earnings. (One study suggests that long-term unemployment can cut one's lifetime earning potential by as much as 20%.) The longer that the job market remains bleak (remember, it's been 5 years and counting), the more people fall into the category of long-term unemployed, whether or not the government counts them as such. In the short term, that means a drag on the economy. In the long-term, that means the creation of a new underclass.

Seth Mason, Charleston SC