Showing posts with label BLS. Show all posts

Friday, January 10, 2014

More Bureau Of Labor Statistics Data Manipulation?

Seth Mason Charleston SC blog 12Last month, I predicted that the Bureau of Labor Statistics would remove from the workforce many of the 1.3 million Americans who lost their unemployment benefits this month. And that's exactly what happened. According to the BLS, 5 people left the workforce for every job added last month. And yet, the unemployment rate mysteriously fell from 7% to 6.7%.

The BLS, which is under investigation for data manipulation, has been proven wrong before. According to ZeroHedge, here's what the "headline" unemployment rate would look like if the bureau used the 30-year average labor force participation rate as opposed to its current 1970s rate. Keep in mind that this chart DOESN'T COUNT the tens of millions of UNDERemployed Americans. Lest we forget, a woefully insufficient number of "breadwinner" jobs have been created since the economy crashed.

More Bureau Of Labor Statistics Data Manipulation - real unemployment rate

Using the 30 year average labor force participation rate, we get a headline unemployment rate hovering between 11 and 12 percent. And, again, that doesn't count the tens of millions of Americans working below their capabilities. Gallup pegs the UNDERemployment rate at 17.2%. Recalculating the underemployment rate using the 30-year average participation rate, we get a number closer to 20%.

The BLS, of course, has been crushing down the headline unemployment rate by crushing down the labor force participation rate, as evidenced by the following chart:

More Bureau Of Labor Statistics Data Manipulation - unemployment vs. labor force participation

Considering this next chart, it's highly unlikely that unemployment has dropped from 10% to 6% over the last few years, as the BLS has been reporting.

More Bureau Of Labor Statistics Data Manipulation - mean duration of unemployment

Friday, May 3, 2013

April Employment Increase: Nothing But Menial Jobs

Seth Mason Charleston SC blog 21Readers of this blog know that Washington's employment data should be scrutinized. The Bureau of Labor Statistics is notorious for crushing down the labor force participation rate in order to make it appear that the unemployment rate is falling, and the agency's survey methodology is fundamentally-flawed, according to a former BLS leader. But, even if you take the government's word on unemployment as the "Gospel truth", a 50,000-150,000 monthly net increase in jobs--as Uncle Sam has been reporting for years--is woefully insufficient. At this rate of increase--with the unemployment rate dropping by a tenth of a percent each month--, it would take until 2017 to get back to the lower end of the "full employment" range. And that's IF the economy has no additional difficulties and WITH the help of a crushed-down labor participation rate. And, that's if you consider 5% unemployment and 10% underemployment "full employment".

But the raw jobs numbers don't tell the full story anyway. What does it matter if 50,000 or 150,000 or even 1,000,000 jobs are created each month if the jobs are menial in nature? And make no mistake: we've been seeing for years little but a monthly increase in low-wage, low-skill jobs. The April jobs report showed more of the same.

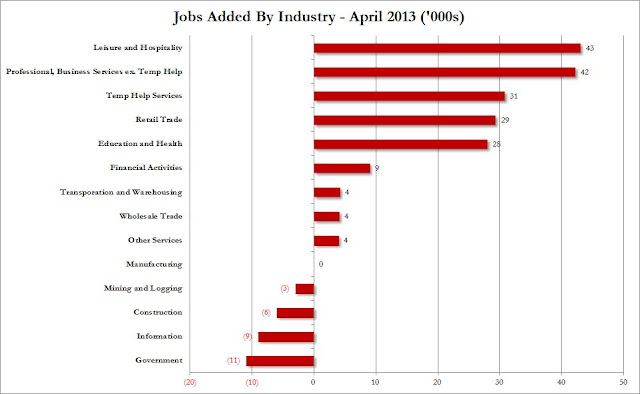
The overwhelming majority of jobs created last month were in leisure and hospitality (waiters, bartenders, hotel employees, etc.) and temp jobs. Industries that actually produce something, whether it be information or physical goods, actually lost jobs:

April Employment Increase: Nothing But Menial Jobs - Jobs By Industry


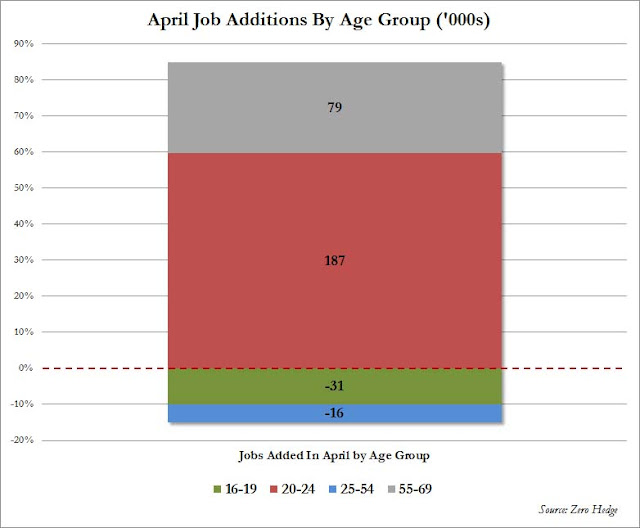
There was a net decrease in jobs for Americans of prime working age, i.e. there was a net decrease in "career" jobs. But there was a net increase in jobs for Americans of prime restaurant worker and Walmart greeter ages:

April Employment Increase: Nothing But Menial Jobs - Jobs By Age Group


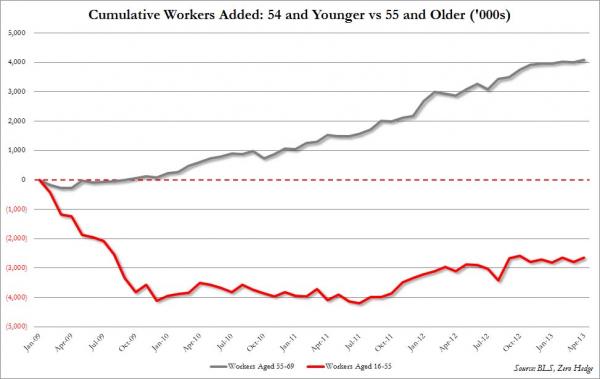
In fact, the number of jobs for Americans of prime working age (i.e. career age) has been flat since the economy collapsed:

April Employment Increase: Nothing But Menial Jobs - Retirees Remaining In The Workforce

Seth Mason, Charleston SC

Wednesday, March 13, 2013

The Falling Unemployment Rate Lie Visualized

Seth Mason Charleston SC blog 32
If you get your business/economics news from sources outside of the MSM, you're likely aware that the BLS has been crushing down the labor force participation rate in order to lower the unemployment rate. But even the well-informed may not have seen a chart of the data massaging.

Washington has been selling the narrative that a population the size of New York City--approximately 10 million people--have thought that an economic depression would be a good time in which to either retire, stop looking for work, or reach working age but not even look for a job. As you can see, since the Great Depression, the unemployment rate has never fallen in tandem with the labor force participation rate like it has since the Great Recession:

The Falling Unemployment Rate Lie Visualized - unemployment vs. labor force participation

Thursday, October 11, 2012

Jobs Report Statistically Impossible

Seth Mason Charleston SC blog 38
Let's do a statistical analysis of that infamous September jobs report that Rick Santelli tore apart the other day in his epic on-air rant. The report showed initial unemployment claims of 339K. That's nearly 6--six--standard deviations away from the mean consensus estimate of 368K. For those unfamiliar with statistics, that's a lot. It's so much, in fact, that the probability of such a statistical anomaly occurring is well below 1%. (6 standard deviations is about as close as you can get to 0% without reaching it.)

Jobs Report Statistically Impossible - chart 1

If that didn't knock you over the head, there's more: The divergence between the reported ("headline") weekly numbers and the revised numbers keeps getting larger. As of the last report, the BLS has added 200K initial claims to its revisions. This would suggest that when the September jobs report is revised, several thousand initial claims will be added to the reported 339K.

Jobs Report Statistically Impossible - chart 2
 
But there's still more: The last time we saw such a large month-to-month drop in initial claims was February 2006, when layoffs were unusually low (because we were at top of the housing bubble) following typical seasonal layoffs in January.

Jobs Report Statistically Impossible - chart 3

Add all this together, and you get a September jobs report that's not a statistical improbability; it's a statistical impossibility.

Seth Mason, Charleston SC

Tuesday, October 9, 2012

Rick Santelli's Epic Rant On Jobs Report

Seth Mason Charleston SC blog 39
Watch CNBC's Rick Santelli go on a tear about the BLS's improbable September jobs report: